📈 New Data on Subscriptions + Recurring Giving
If you know me, you know that I believe that recurring revenue, specifically sustainable “subscription” giving for nonprofits, is one of the most significant opportunities facing charities today.
Article
Growing Recurring “Subscription” Giving in 2024
A three-step guide to getting started with growing sustainer giving
Three reports released just this week reinforce the opportunity for nonprofits to tap into growing consumer and donor comfort with giving to the charities that matter most to them on an ongoing basis.
Let’s look at the highlights from each report and what we can take away to apply to growing our programs in 2024.
The Subscription Economy Index Report
Subscription businesses continue to outpace the general market.
The Subscription Economy Index has been the go-to benchmark for the subscription economy for 12 years running. Created by Zuora, a company specializing in monetizing subscriptions, the latest SEI Report charts subscription business growth against the general market (S&P500).
The data is in through the end of 2023, and over the last 12 years, subscription businesses have grown more than 3.4 times that of the general market.
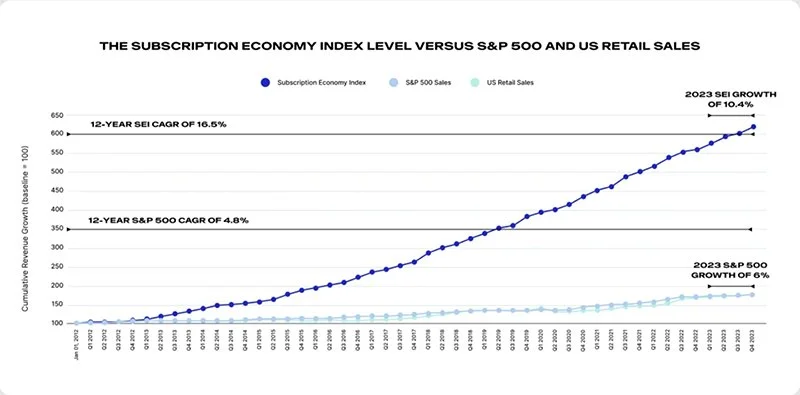
Above: Subscription-oriented businesses outperformed the general market by 244% over the past 12 years and by 73% in 2023 alone.
The contrast between subscriptions and the general market became even more dramatic in 2023 when subscription businesses grew 73% faster than the S&P500.
Subscription businesses are focused on providing ongoing value and reducing churn.
As subscriptions focus more on providing ongoing value and a great experience, customer churn has decreased – a sign that subscriptions focus more on retention and providing ongoing value to customers.

Above: As subscription fatigue has become a real phenomenon, subscription-oriented businesses have focused on providing ongoing value and decreasing churn. Read the full Subscription Economy Report at www.zuora.com/resource/sei-report.
The report also shows that as subscriptions mature, new subscriber acquisition is a heavier lift. New customer growth is increasingly challenging for mature subscriptions (think Netflix and Spotify).
However, this slowdown in acquisition is not the same issue for nonprofits, who are just getting started in growing recurring donor giving, or what I refer to as subscription recurring giving. We’ll look at that in our next study.
💡 Takeaway: Subscriptions are still going strong, and as the market matures, subscription businesses are focused on providing great ongoing value to improve retention. According to UBS, the Subscription Economy is predicted to reach $1.5 trillion in 2025.
Next, let’s look at The Recurring Giving Report, released by Neon One this week.
The Recurring Giving Report
Nonprofits see unprecedented growth in recurring giving.
While recurring revenue has proven to be a powerful business model, charities are even more growth in sustainable recurring giving.
The Recurring Giving Report, produced by fundraising platform Neon One, examines recurring giving data from 2,149 nonprofits over the past five years. It is the most comprehensive data set we’ve ever seen on recurring giving.
I highly recommend downloading the full report, but let me share just a few highlights that stood out to me:
📊 The average nonprofit in the study saw 144% growth in recurring revenue since 2018. By contrast, over those same five years, overall donation revenue barely kept pace with inflation (13% growth vs. 14.2% inflation). The sizes of the programs vary widely, with the average nonprofit bringing in $15,470 in 2022.
📊 The average monthly gift was $79.10, or $949 annually. Given our experience with larger nonprofits who typically see a lower monthly average gift, this amount surprised me. I wonder whether this is due to less mature recurring giving programs garnering higher average gifts because donors are self-selecting to give monthly. Either way, these monthly donors are proving to be highly valuable.
📊 The percentage of active donors that are recurring is hovering just above 3% for the average nonprofit. While this is an increase from 1.8% in 2018, I would have expected a higher number – it’s an area for continued improvement and growth across the sector.
📊 Retention for recurring donors is consistently rock solid at 77%. By contrast, retention of non-recurring donors is down over five years (from 38% to 34%). Recurring donors continue to be consistent givers.
📊 The average donor lifetime is 1.68 years for a single gift donor versus 7.71 years for a recurring donor, resulting in significantly higher long-term value. Charities that invest in recurring giving see long-term returns.

Above: A slide from Neon One’s recent presentation of The Recurring Giving Report illustrates the longevity and value of recurring donors.
I’ve been saying for years that there is too little data available on the trends in recurring giving, so I was incredibly encouraged to see this report.
Special thanks to the entire team at Neon One, including Tim Sarrantonio and Abby Jarvis for pulling together the report, and to Erica Waasdorp and Dana Snyder for contributing expert insights as well!
💡 Takeaway: The average nonprofit in Neon One’s study saw 144% growth in revenue from recurring donors, at a rock-solid 77% retention rate and an average lifespan of more than seven years. However, the average nonprofit sees just 3% of their active donors giving recurring, suggesting major opportunities for growth.
M+R Benchmarks 2024
Nonprofits see unprecedented growth in recurring giving.
The big headline in the annual M+R Benchmarks 2024 Report is that online giving is down 1%, direct mail giving is down 6%, and recurring giving continues to grow.
On Wednesday, I posted a quick video unpacking the trend, if you’d like to give it a watch.
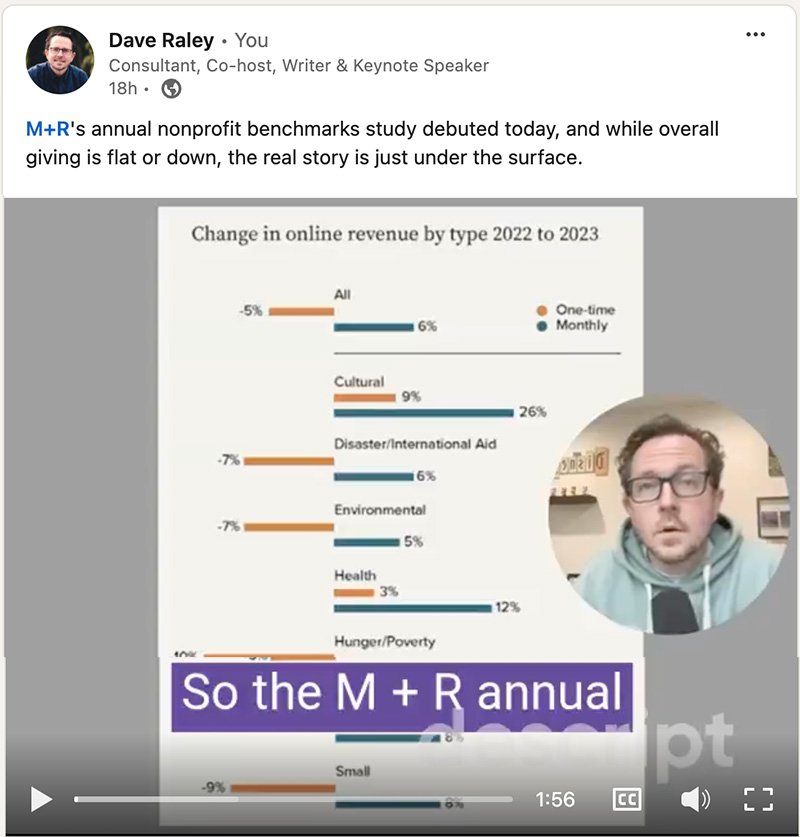
Above: Despite online revenue being down overall (-1%), under the surface, we see that recurring revenue is growing while one-time revenue is declining.
M+R has published the longest-running and one of the most helpful annual reports on online fundraising in the industry, so special thanks to them for this great piece of research.
💡 Takeaway: Every sector and size of nonprofit saw growth in online recurring giving in 2023 despite significant downward pressure from one-time giving. Given an intentional focus and a holistic approach, the question in 2024 is not whether you can grow recurring giving but by how much.
How about you? Are you focused on growing recurring revenue in 2024? Check out my article on Growing Recurring “Subscription” Giving in 2024.
Sustainer Growth Assessment & Action Plan
Helping grow sustainable recurring giving is one of our favorite things to do. As an advisory firm, we offer a Sustainer Growth Assessment & Action Plan, which includes an 11-point assessment:
Structure and Team
The Program
Acquisition
Conversion
Cultivation
Retention
Upgrade
Cancellation
Reactivation
Reporting and Key Metrics
Systems and Platforms
We include qualitative and quantitative elements, including interviews with key leadership, a review of all existing and relevant past strategies, processes, and systems, key metrics and health indicators, team structure, and a review of giftings, opportunities, and gaps.
If this interests you, you can contact us on the website.
Until next week… Surfs Up! 🌊
- Dave
About the Author | Dave Raley
Consultant, speaker, and writer Dave Raley is the founder of Imago Consulting, a firm that helps non-profits and businesses create profitable growth through sustainable innovation. He’s the author of a weekly trendspotting report called The Wave Report, and the co-founder of the Purpose & Profit Podcast — a show about the ideas at the intersection of nonprofit causes and for-profit brands.
Want to receive insights like this weekly?
Every Friday, we send out The Wave Report, highlighting one trend or insight “wave,” from donor and consumer trends to innovation in different industries or new models for growth.
Subscribe today to receive free weekly insights in your inbox here: